 Bristol Myers Squibb (BMY) reported strong Q4 earnings earlier in February, and prospects remain strong for 2025, although it may face some headwinds. The recent earnings announcement for the company led to a pullback in the stock price; however, BMY is now showing signs of recovery and gaining some momentum.
The stock caught my interest when I ran my StockCharts Technical Rank (SCTR) scan on Thursday evening. An attractive price point and the recent strength of the Health Care sector enticed me to do a deeper dive into the stock’s charts.
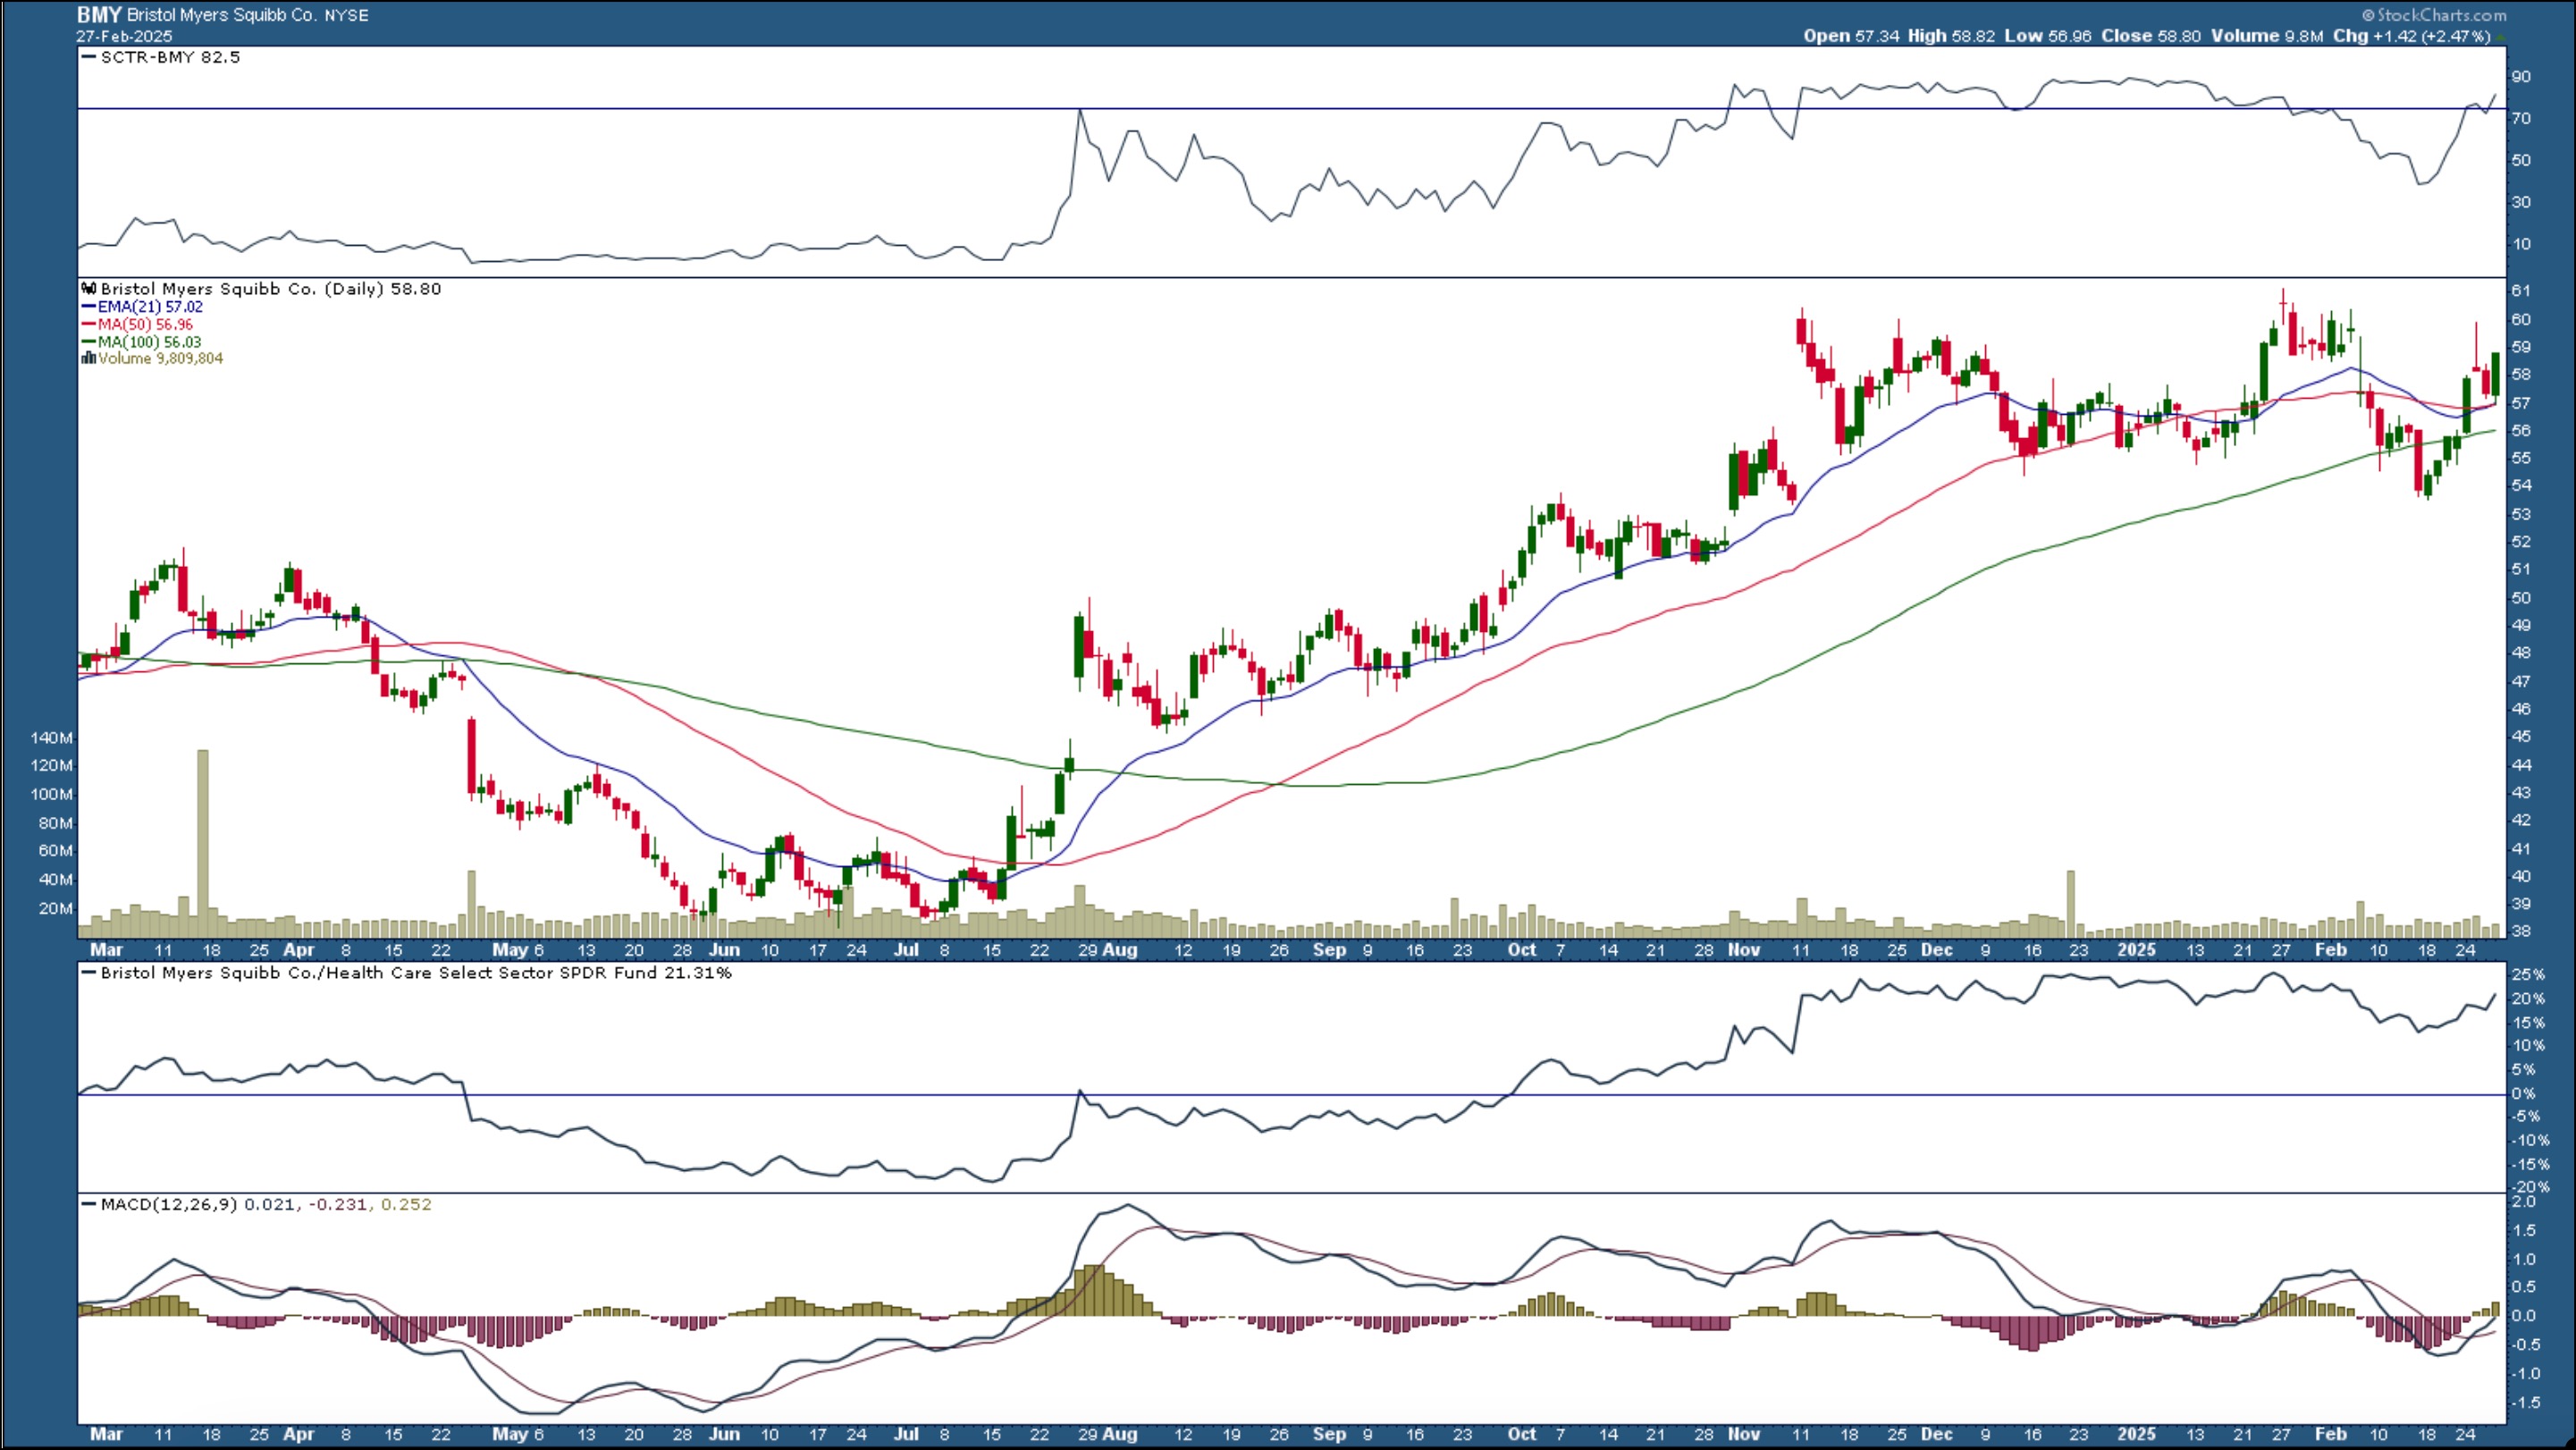
The Health Care sector was in a steady downfall from September to December 2024. Bristol Myers Squibb (BMY) deviated from the downfall and trended higher during this time. The daily chart of BMY below shows the stock’s performance relative to the Health Care Select Sector SPDR Fund (XLV). Since September 30, 2024, BMY’s performance has outperformed XLV’s. Even during the February pullback, the stock was performing better than the Health Care sector.

FIGURE 1. DAILY CHART OF BRISTOL MYERS SQUIBB. The SCTR score has crossed 76, the MACD is crossing over into positive territory, and BMY is outperforming XLV.Chart source: StockCharts.com. For educational purposes.
The SCTR score in the upper panel didn’t display strength until November and, even though it crossed above 76, it didn’t go higher than 92. In late January, the SCTR score fell below the 76 level.
The following points are worth noting:
- The stock price bounced off its 21-day exponential moving average (EMA) and 50-day SMA on Thursday.
- The SCTR score has crossed above the 76 level.
- Bristol Myers Squibb’s relative performance against XLV is at 21.31% and trending higher.
- The moving average convergence/divergence (MACD) has crossed above its signal line and is very close to the zero line.
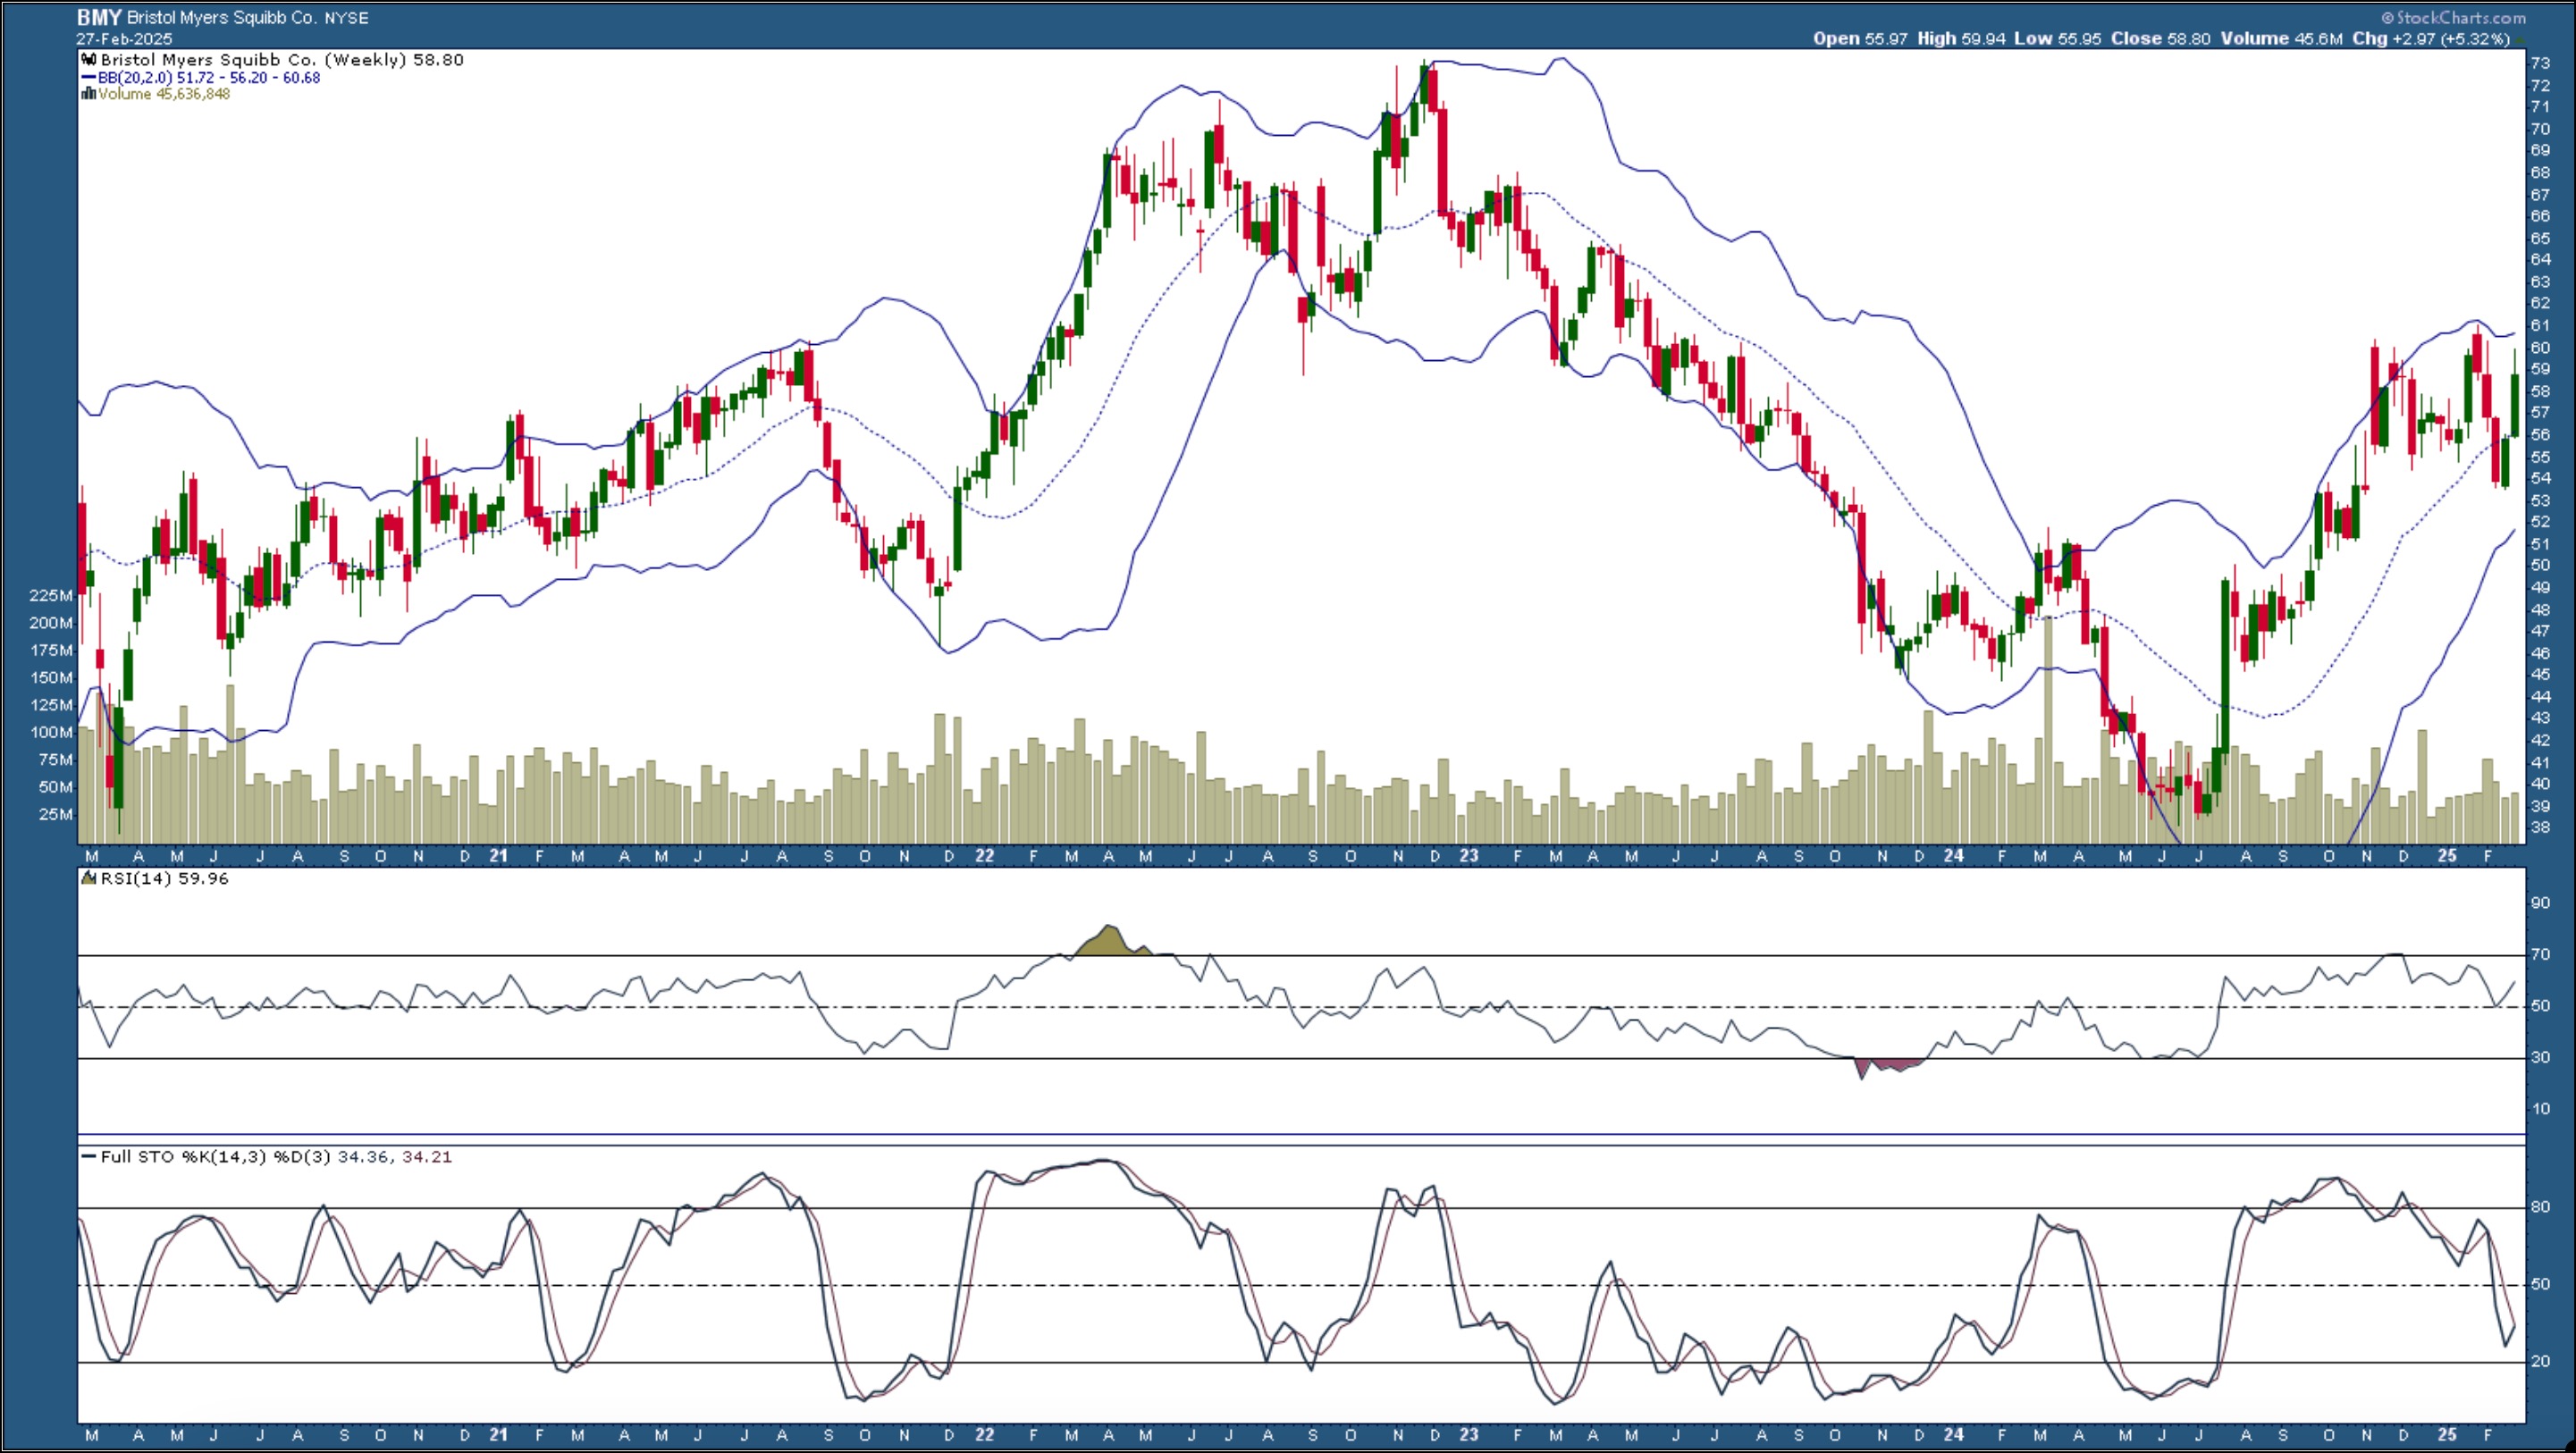
If BMY’s stock price continues to rise higher there could be an opportunity to add some positions of this stock. How high could the stock price go? The probability of BMY hitting its 52-week high is high, but, for a favorable risk-to-reward ratio, there needs to be strong upside momentum. The weekly chart below shows the stock has the potential to rise to around the $72 level.

FIGURE 2. WEEKLY CHART OF BRISTOL MYERS SQUIBB. A break above the upper Bollinger Band, rising RSI, and crossover of the stochastic oscillator point to further upside move in the stock price.Chart source: StockCharts.com. For educational purposes.
- A break above the upper Bollinger Band® would be positive for the stock.
- The relative strength index (RSI) is just shy of 60. A cross above 70 would confirm upside momentum.
- Look for the %K line to cross over the %D line in the full stochastic oscillator (lower panel).
The bottom line: I’ll be monitoring Bristol Myers Squibb’s stock price closely. I’ve set an alert to notify me when the stock price crosses above $61. If the indicators in the daily chart still indicate buying pressure is strong and the trend is bullish, I’ll consider adding BMY to my portfolio.
The SCTR Scan
[country is US] and [sma(20,volume) > 100000] and [[SCTR.us.etf x 76] or [SCTR.large x 76] or [SCTR.us.etf x 78] or [SCTR.large x 78] or [SCTR.us.etf x 80] or [SCTR.large x 80]]

Disclaimer: This blog is for educational purposes only and should not be construed as financial advice. The ideas and strategies should never be used without first assessing your own personal and financial situation, or without consulting a financial professional.


