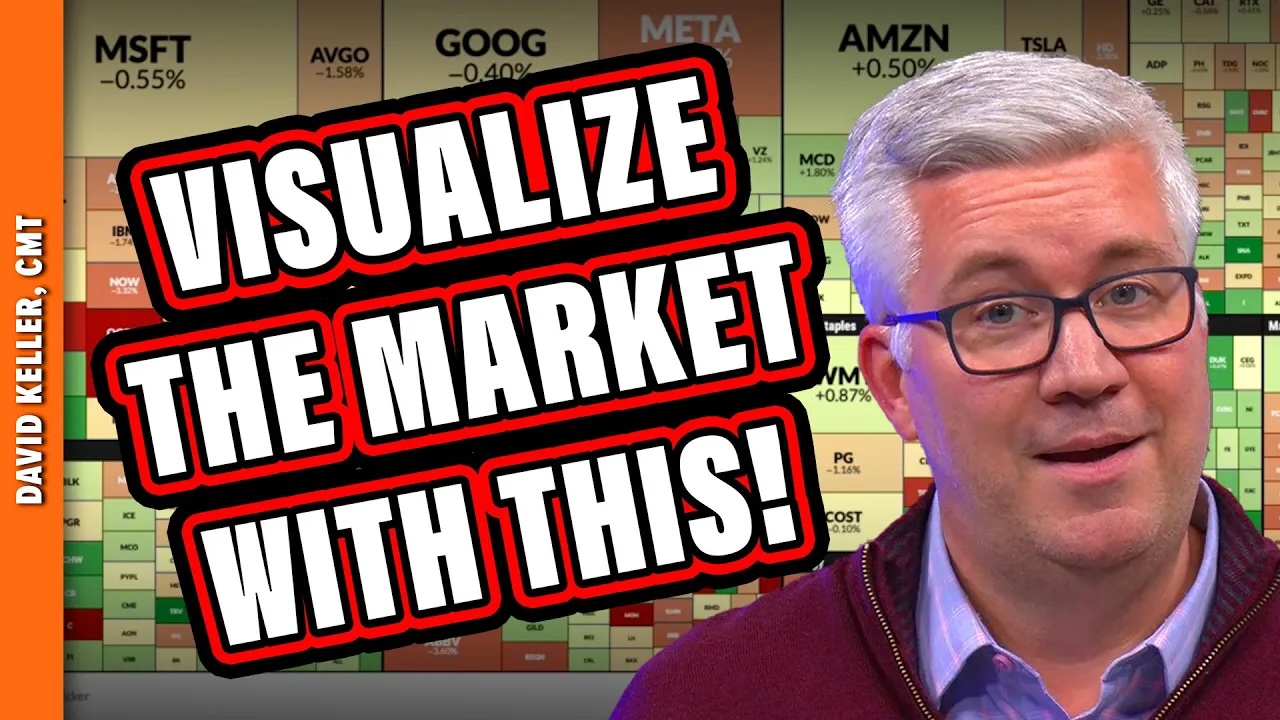
 How do you track movements of all the S&P 500 stocks on any given trading day? In this video, Dave will show you how he uses the StockCharts MarketCarpet to evaluate broad equity market conditions, assess the changes in the mega-cap stocks which dominate the benchmarks, and identify potential outliers that could serve as investment candidates. Enjoy this mini-masterclass on how to use a powerful heat map to better follow the technical analysis trends!
This video originally premiered on October 21, 2024. Watch on our dedicated David Keller page on StockCharts TV!
Previously recorded videos from Dave are available at this link.


