


Wells Fargo (WFC)’s stock price has been trending higher since November 2023, after it broke out above a downward-sloping trendline. The company has had its share of woes, which is evident in its stock price’s choppy movement. Overall, though, the stock, along with other big banks, has been trending higher and has hit a new all-time high.
So is the stock worth buying? Let’s analyze the Financial sector and dive into WFC’s stock charts.
Bullish Percent Index
The chart below of the S&P Financial Sector Bullish Percent Index ($BPFINA) shows it’s at 86.11, indicating the Financial sector is bullish. The indicator is turning higher, which suggests that financials may still continue to trend higher.
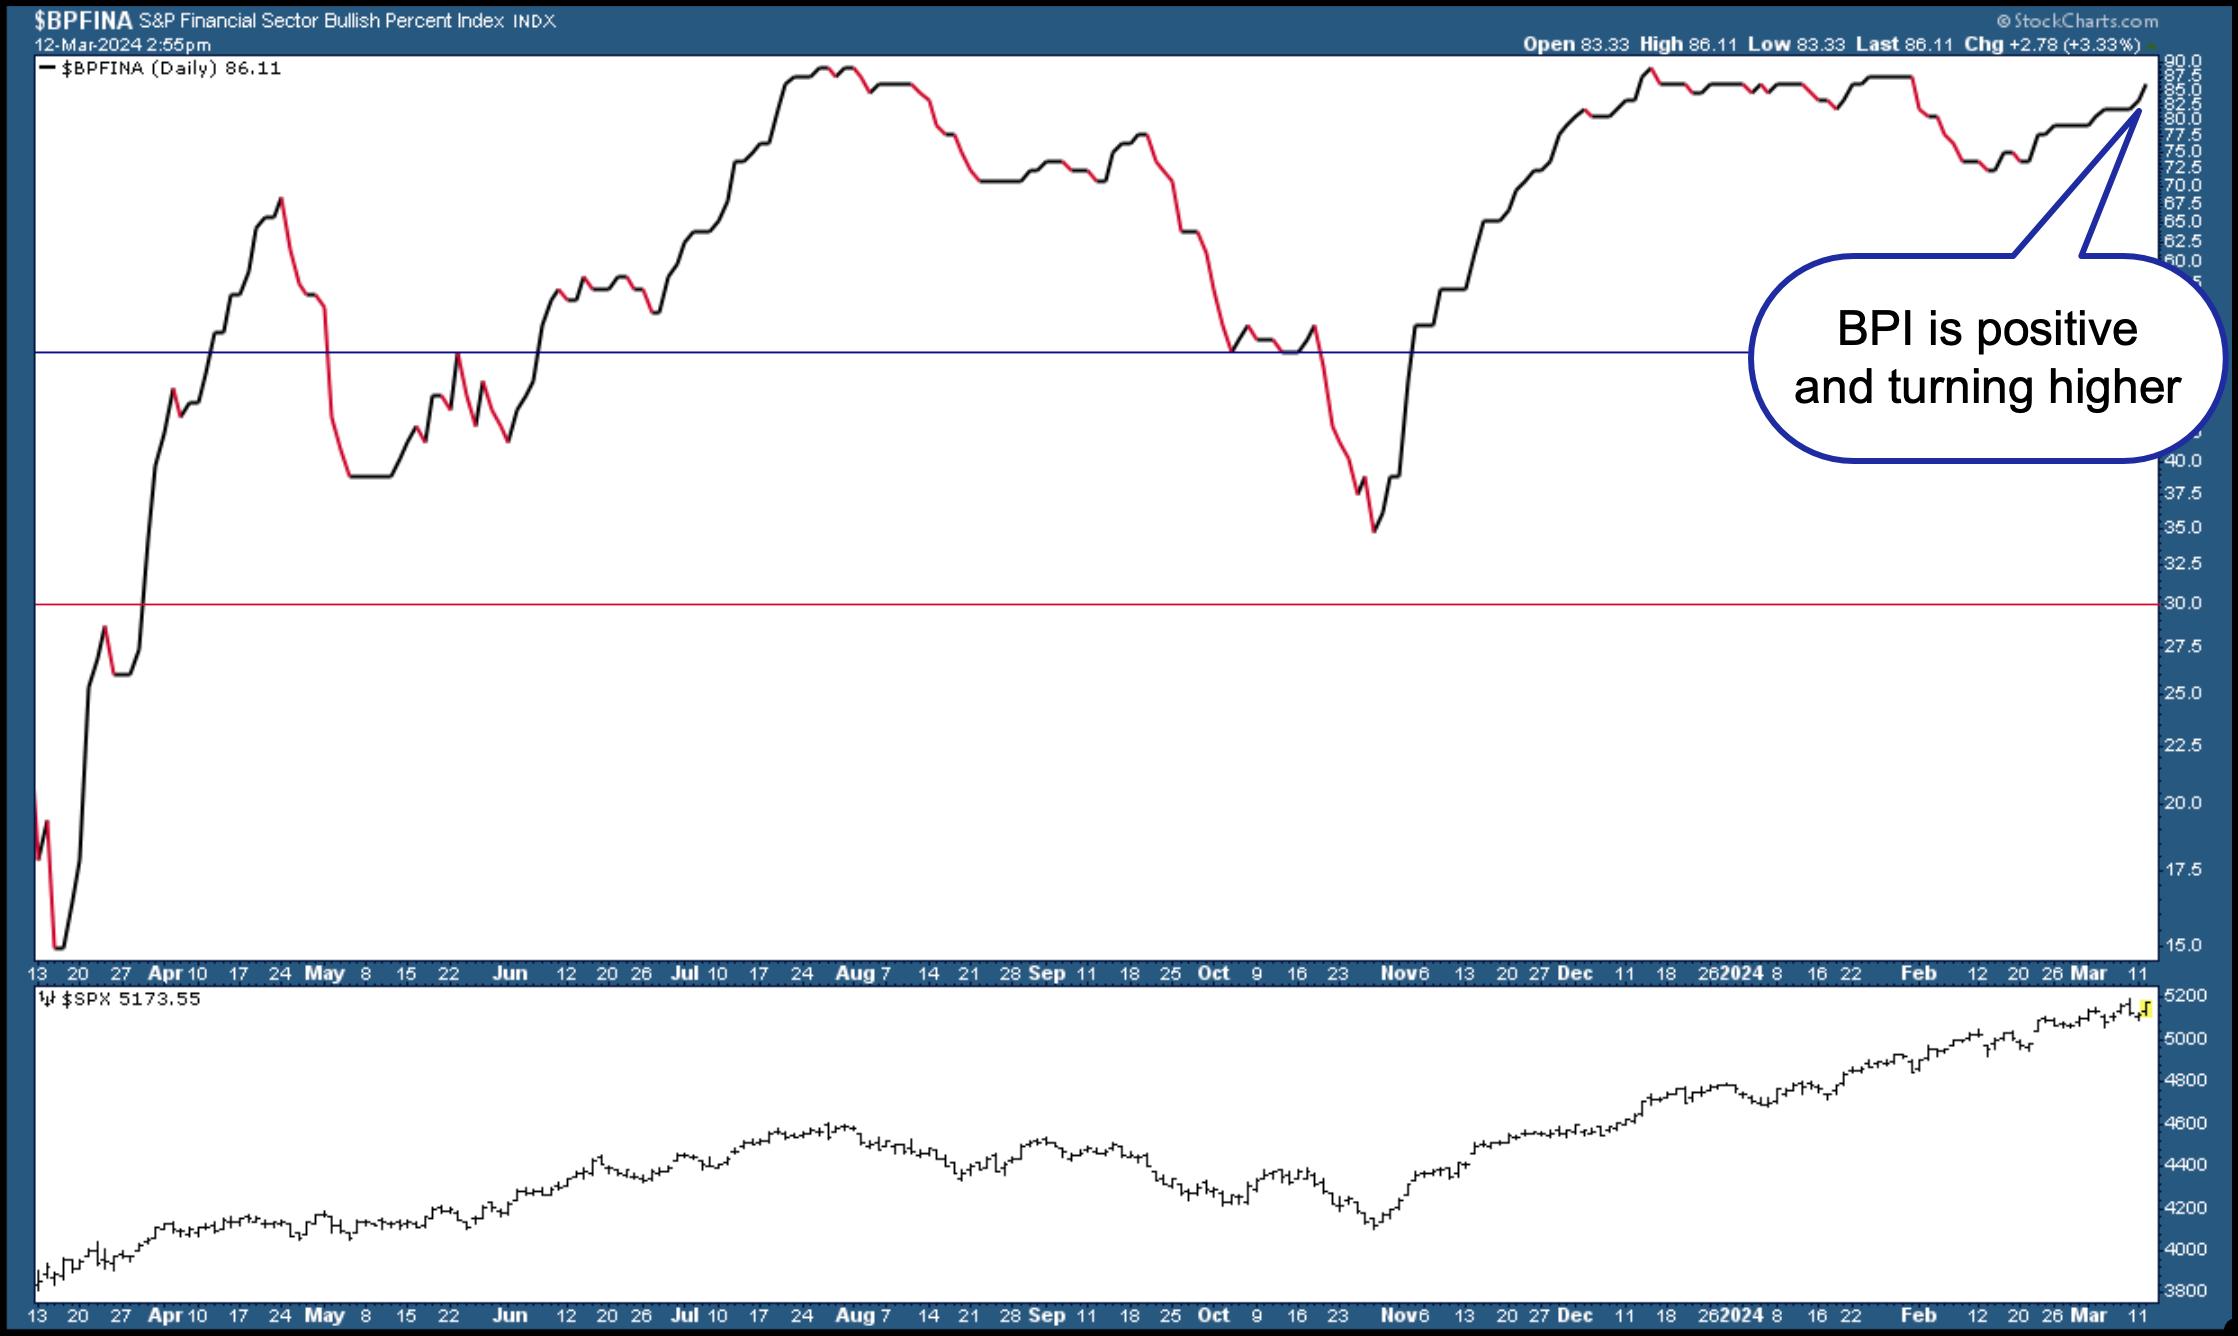
CHART 1. S&P FINANCIAL SECTOR BULLISH PERCENT INDEX (BPI). The Financial sector is bullish and could remain that way for an extended period of time.Chart source: StockCharts.com. For educational purposes.
Sector Summary
If you look at the one-month sector performance using the StockCharts Sector Summary, the Financial Select Sector SPDR (XLF), a proxy for the sector, isn’t the highest performer, but it has the second highest StockCharts Technical Ranking (SCTR) score of 89.
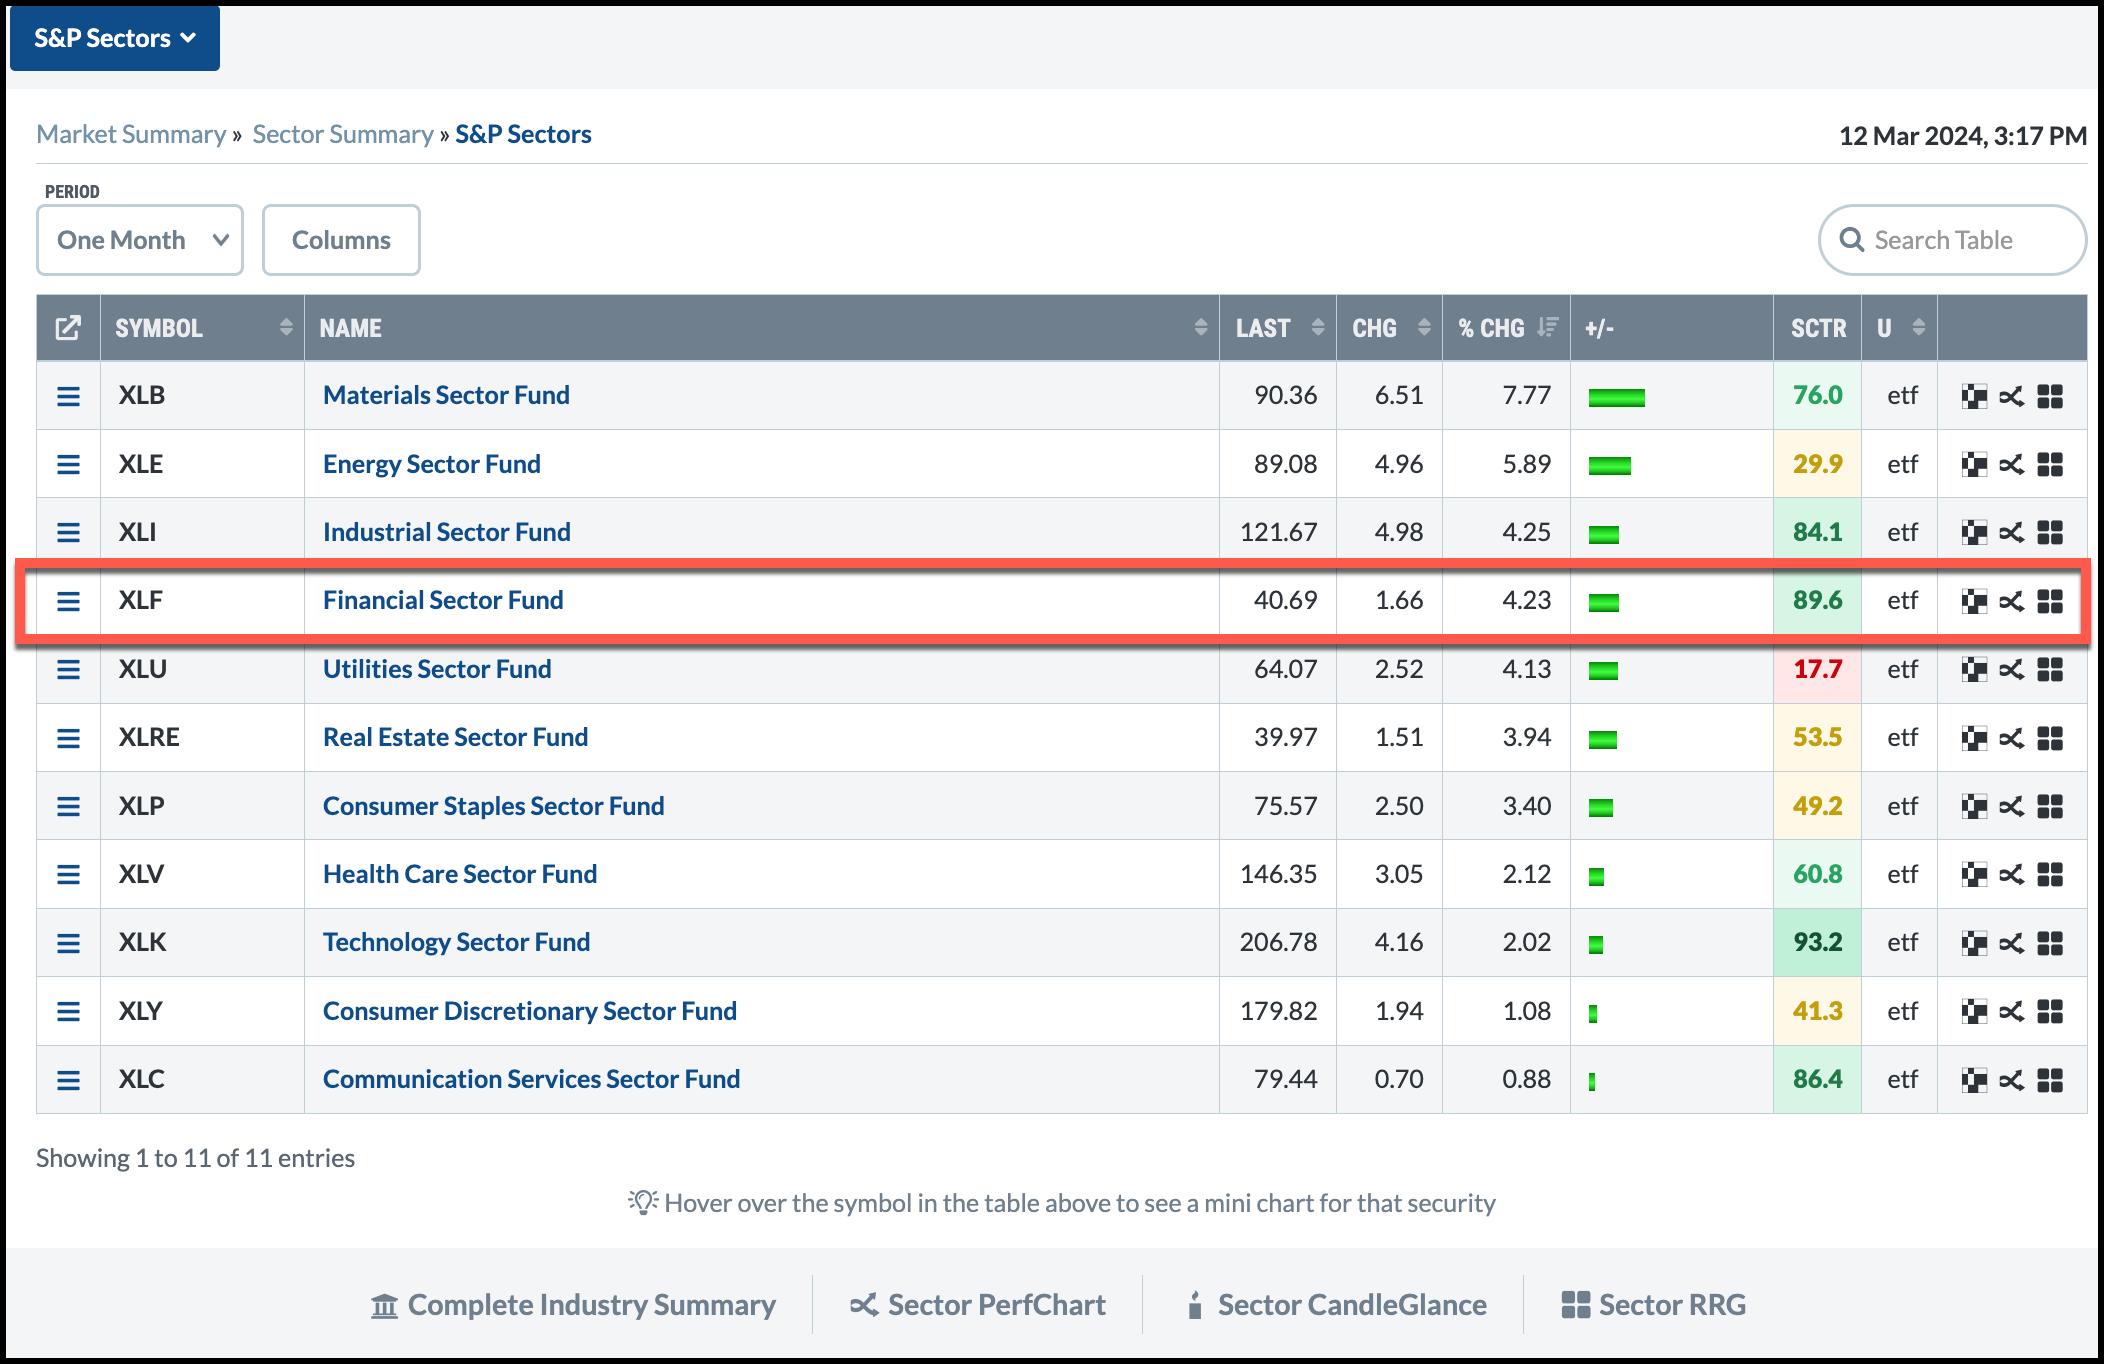
CHART 2. ONE-MONTH SECTOR SUMMARY. The Financial sector may not be the top sector performer, but it has the second-highest SCTR score, which makes it a strong-performing sector.Chart source: StockCharts.com. For educational purposes.
Both data points suggest that the Financial sector is strong and that it is worth checking out WFC stock.
Symbol Summary
The Symbol Summary tool in StockCharts gives you a bird’s-eye view of a stock or exchange-traded fund. Enter WFC in the symbol box and review WFC’s stock chart, fundamental data, technical data, earnings history, SCTR rank, and the predefined scans with WFC. As of this writing, WFC was filtered in four scans—New 52-week Highs, Moved Above Upper Price Channel, P&F Ascending Triple Top Breakout, and P&F Double Top Breakout. The stock appears to be technically strong and gaining strength.
Monthly Chart of WFC Stock
Looking at a 20-year monthly chart, you can see that WFC had its share of choppy movement.
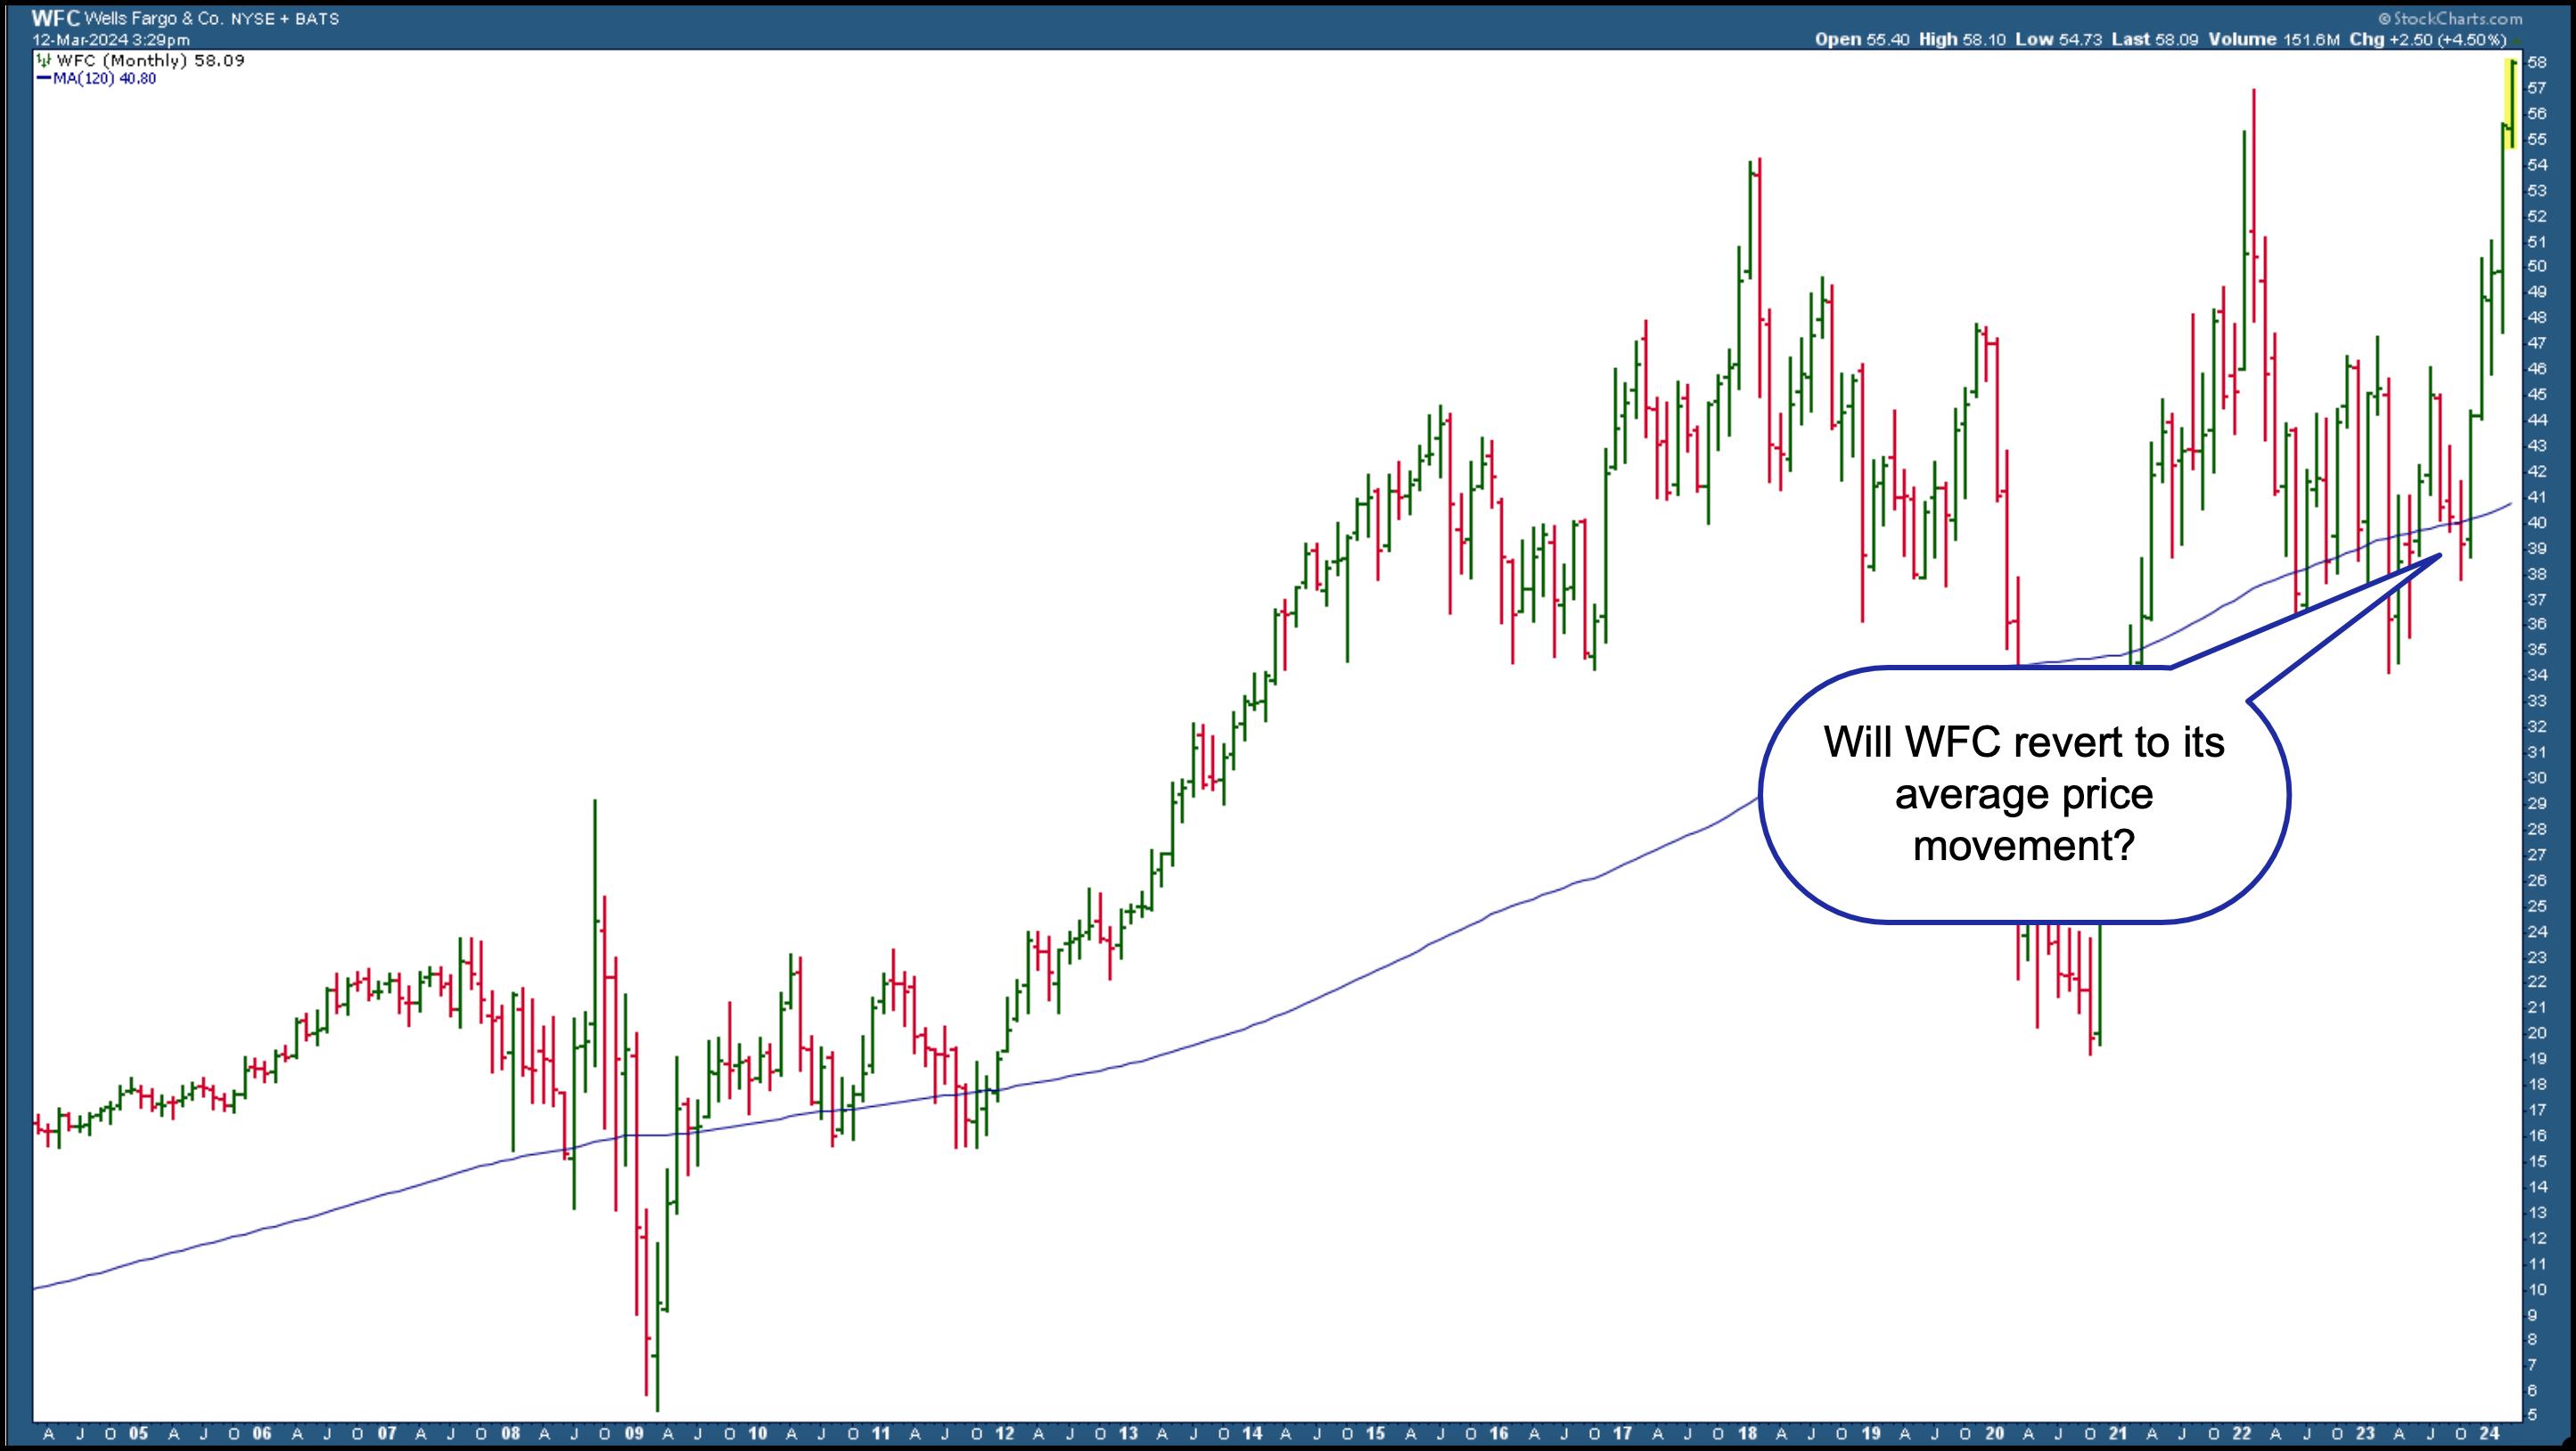
CHART 3. MONTHLY CHART OF WELLS FARGO STOCK. The stock is trending higher, but will it pull back?Chart source: StockCharts.com. For educational purposes.
Overlaying the 120-month simple moving average (SMA) on the monthly chart (representing 10 years), you see that despite the choppy price movement, WFC has been gently trending higher, with the price reverting to average price movement. Since the stock is trading much higher than average, is it likely to pull back?
Daily Chart of WFC Stock
The daily chart of WFC below has a 50-day SMA overlaid on price. The pattern of price movement is similar, in that price tends to revert to the SMA after it deviates from it. So is WFC too toppy, or is it worth the investment after a pullback?
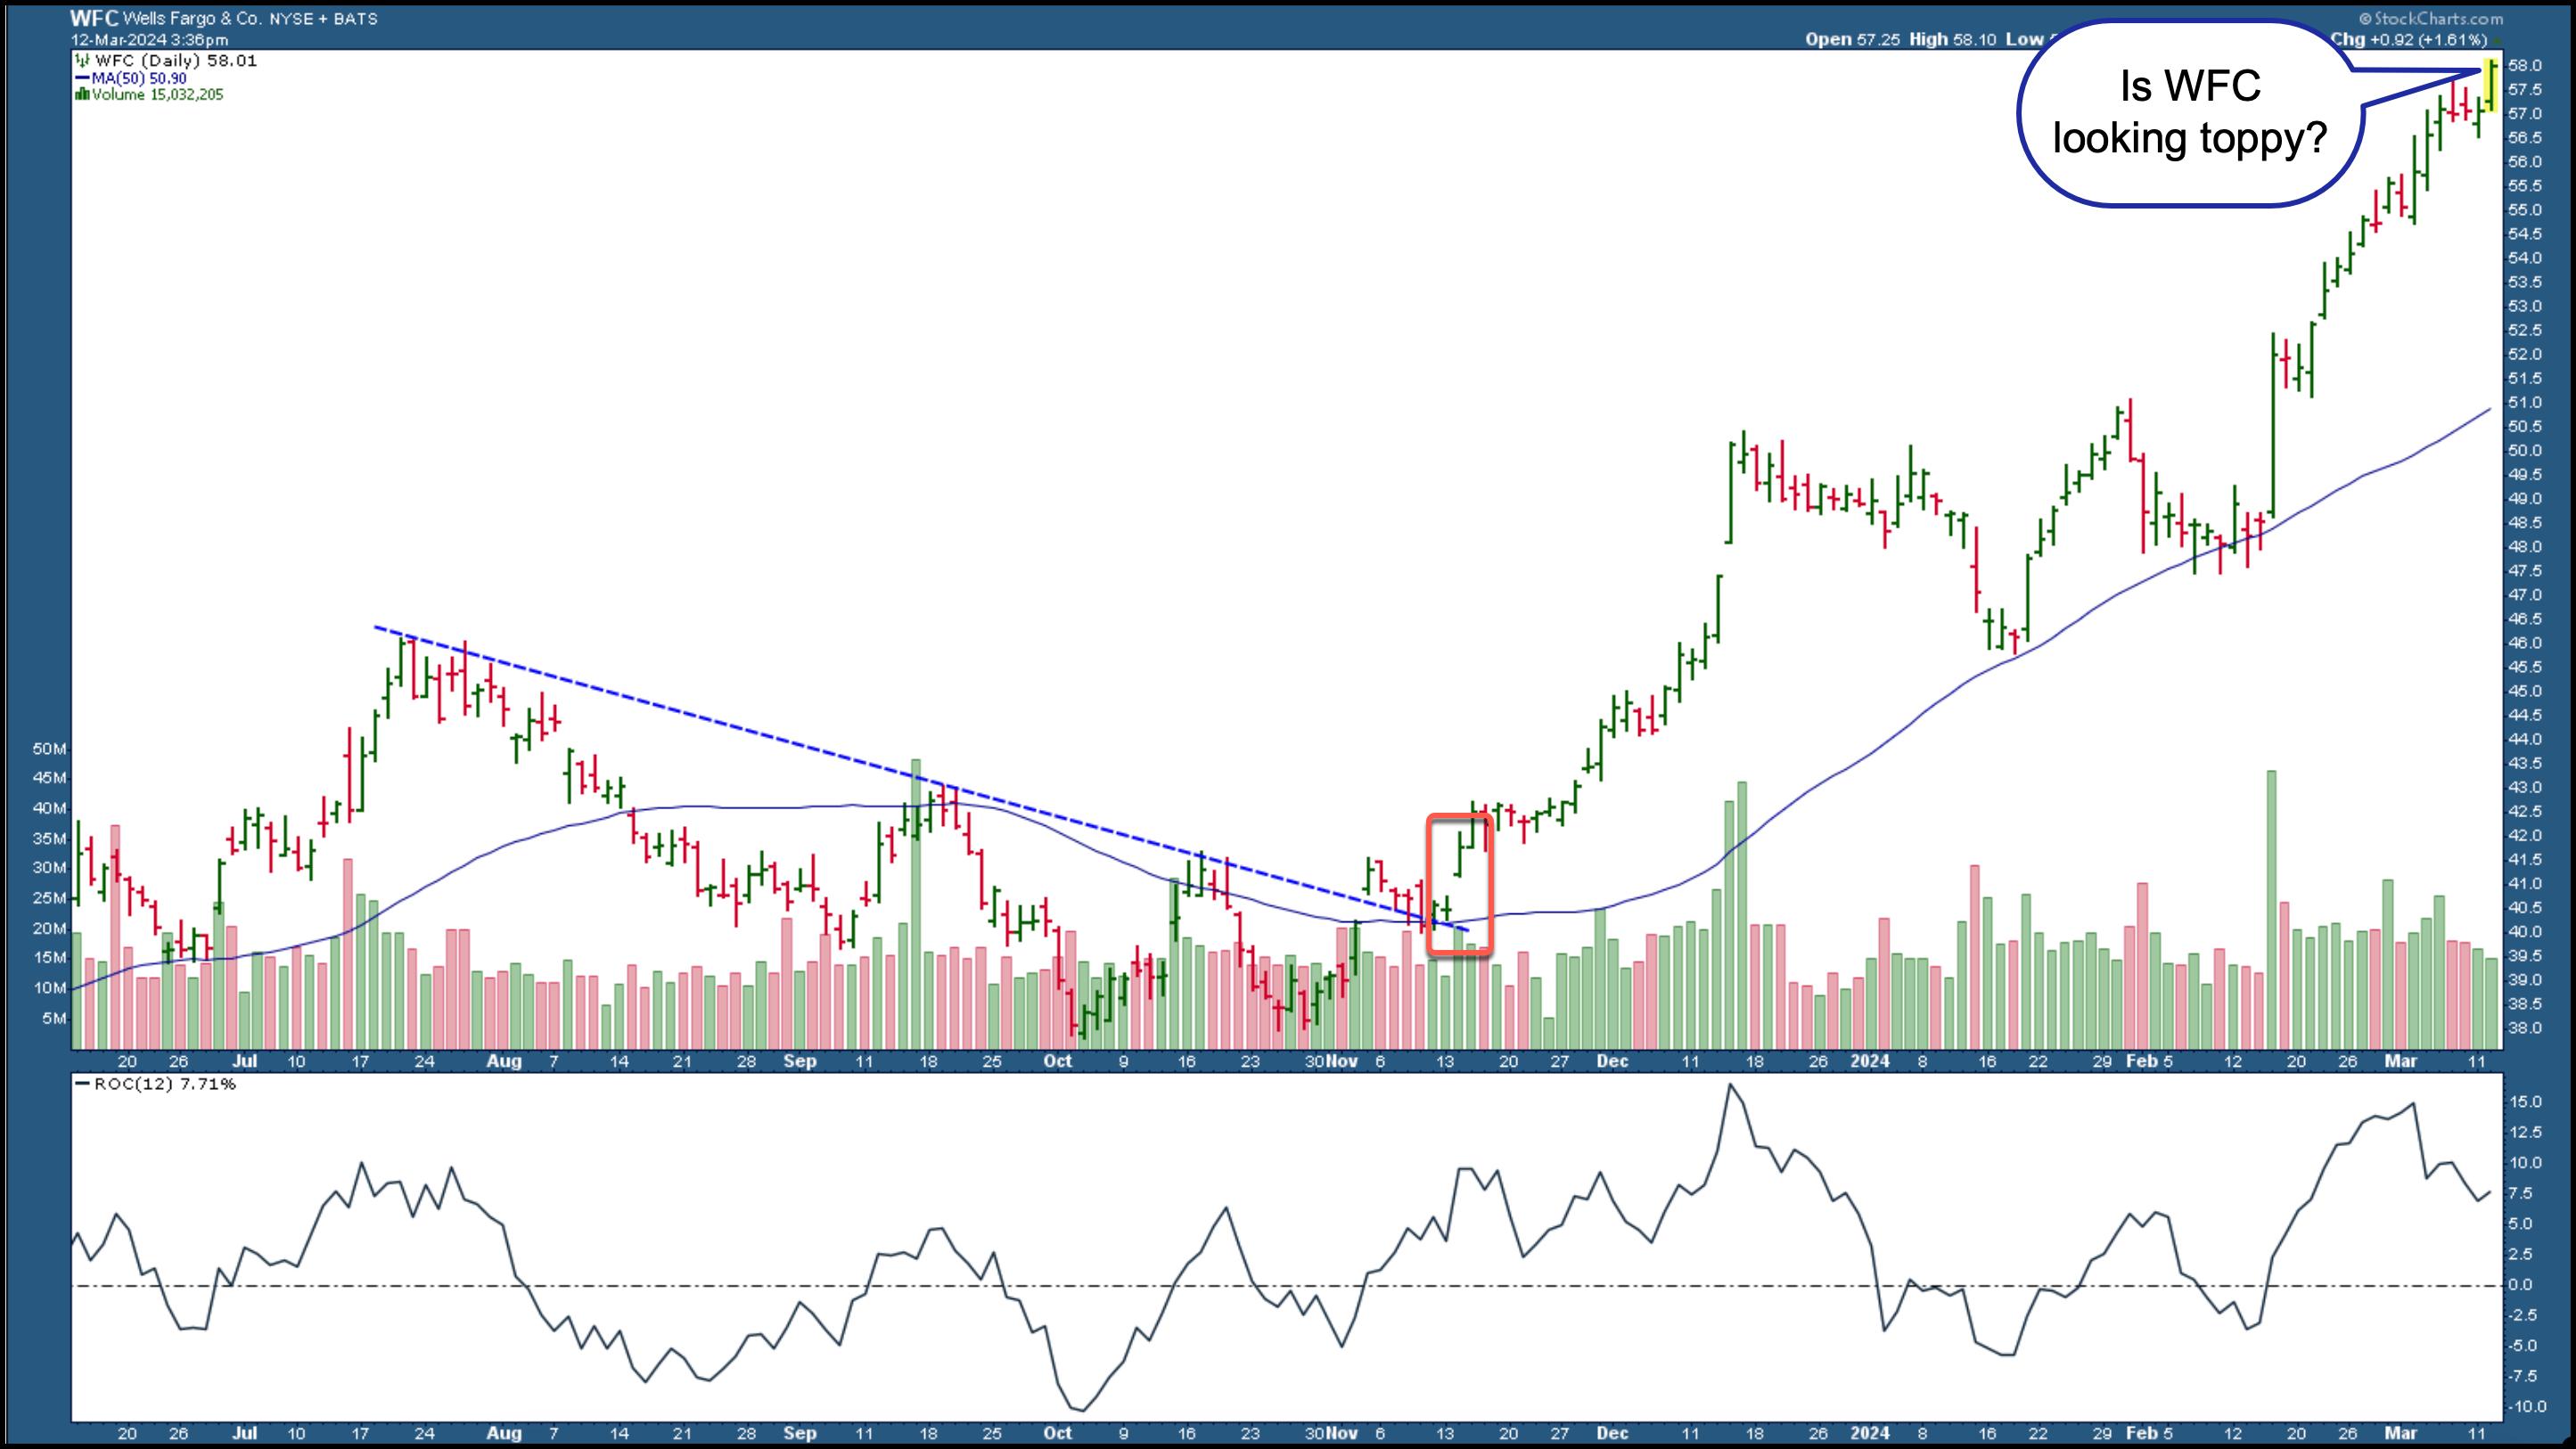
CHART 4. DAILY CHART OF WELLS FARGO STOCK. The stock may be looking toppy, but, if the momentum is still strong, the stock could continue to rise.Chart source: StockCharts.com. For educational purposes.
When a stock hits an all-time high, there’s a reason it’s moving higher. The stock will continue rising as long as the momentum supports the price move. This is why it helps to add a momentum indicator. There are several to choose from—Moving Average Convergence/Divergence (MACD), Relative Strength Index (RSI), Average Directional Index, and Rate of Change (ROC), to name a few.
In this example, the ROC is added to the lower panel below the price chart. Notice the indicator fluctuates above and below the zero line. When the ROC is above the zero line, it indicates positive momentum. The ROC has pulled back, and could reverse and move higher. If ROC moves below the zero line, that’s a signal that momentum is slowing. Note how, in previous pullbacks to the 50-day SMA, the ROC went below the zero line, reversed, and moved back higher.
The Bottom Line
Even though WFC stock is hitting all-time highs, the momentum hasn’t shown signs of slowing down. If you’re nervous about buying a stock that looks toppy, the charts show that WFC could pull back. As long as it stays above its 50-day moving average on the daily chart, you could enter a long position as long as the Financial sector remains healthy and the upward momentum is strong in the stock. If you want to wait till WFC pulls back, it may require some patience—a necessary trait for successful traders and investors.
Disclaimer: This blog is for educational purposes only and should not be construed as financial advice. The ideas and strategies should never be used without first assessing your own personal and financial situation, or without consulting a financial professional.