


The markets continued to trade on expected lines. The trading week was short as Friday was a trading holiday on account of Mahashivratri. In the four trading sessions, the markets stayed choppy and failed to make any definite and convincing moves while they continued to modestly advance on a weekly basis. The trading range also stayed narrow; the Index oscillated in a defined 301.30-point trading range while staying devoid of directional bias on most occasions. The volatility also dipped; the India VIX declined by 10.65% to 13.61. By and large, while not showing any meaningful upsides, the headline index closed with a net weekly gain of 154.80 points (+0.69%).

As we head into a fresh week, the markets remain prone to consolidation at higher levels. The Options data continue to show a buildup of resistance just above the current levels. There are strong possibilities that the markets may show incremental advances, but at the same time, also stay prone to profit-taking bouts at higher levels. A sustained upmove is unlikely and that would happen only if Nifty is able to take out 22600 levels and higher. This warrants a strong vigil at higher levels; it would be important to not only identify opportunities with strong relative strength but also keep protecting profits at higher levels.
Chasing the trend should be done very mindfully and with strict protective stops in place. The coming week is likely to once again see a quiet start to the trade. The levels of 22600 and 22750 are likely to act as resistance levels; supports come in lower at 22230 and 22050 levels.
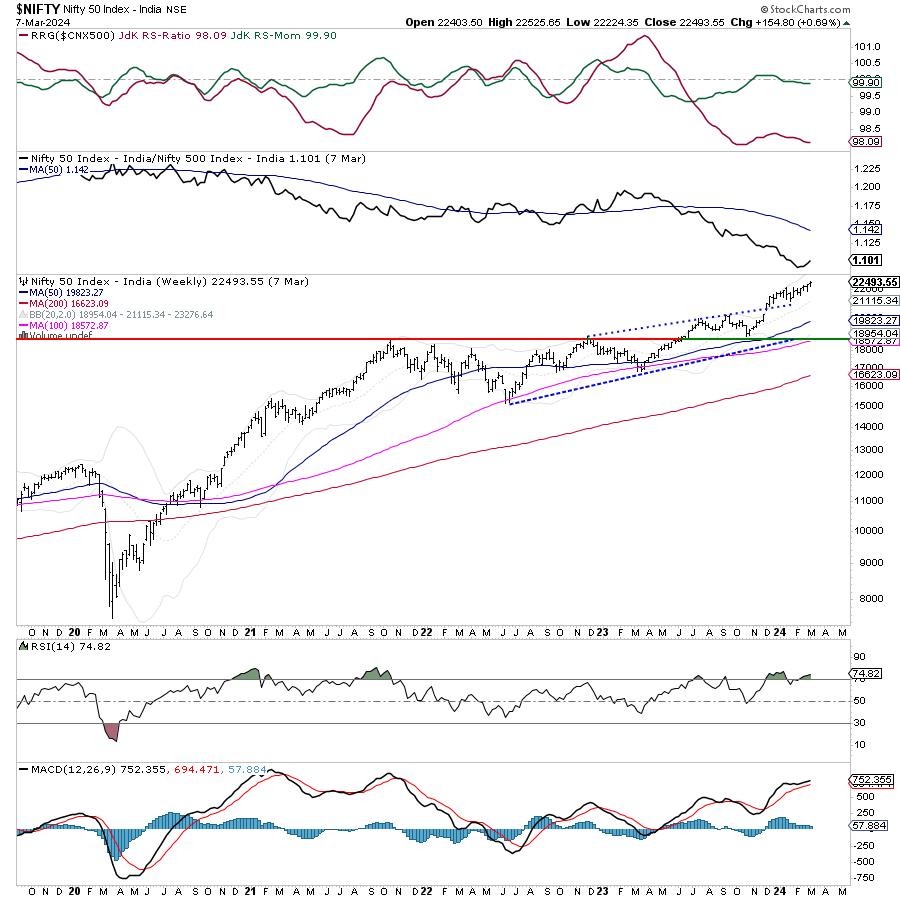
The weekly RSI stands at 74.52; it stays in a mildly overbought zone. It also stays neutral and does not show any divergence against the price. The weekly MACD stays bullish and remains above the signal line.
A candle with a small real body emerged; this denotes the lack of conviction and indecisiveness of the market participants at current levels.
The pattern analysis of the weekly charts shows that the Nifty continues well while advancing the breakout that it achieved as it crossed above 20800 levels. Following a breakout from the rising channel, the Index has continued to advance while forming incremental highs. The bands have gotten wider; there are possibilities that this bulge may kill the trend and push the markets under some consolidation.
There are no signs though on the charts that suggest any corrective move to happen. However, that being said, the technical structure of the charts makes it evident that the markets are at the point of taking a breather. The current uptrend may stay intact or may not immediately reverse, but the Nifty certainly looks prone to some consolidation at higher levels. While we keep following the trend and look for stocks that show improved or strong relative strength, equal importance should be laid on the protection of profits at higher levels. It is strongly recommended that while one may continue to follow the trend, effectively trailed stops may be followed while keeping overall leveraged positions at modest levels. A cautious outlook is advised for the week.
Sector Analysis for the coming week
In our look at Relative Rotation Graphs®, we compared various sectors against CNX500 (NIFTY 500 Index), which represents over 95% of the free float market cap of all the stocks listed.
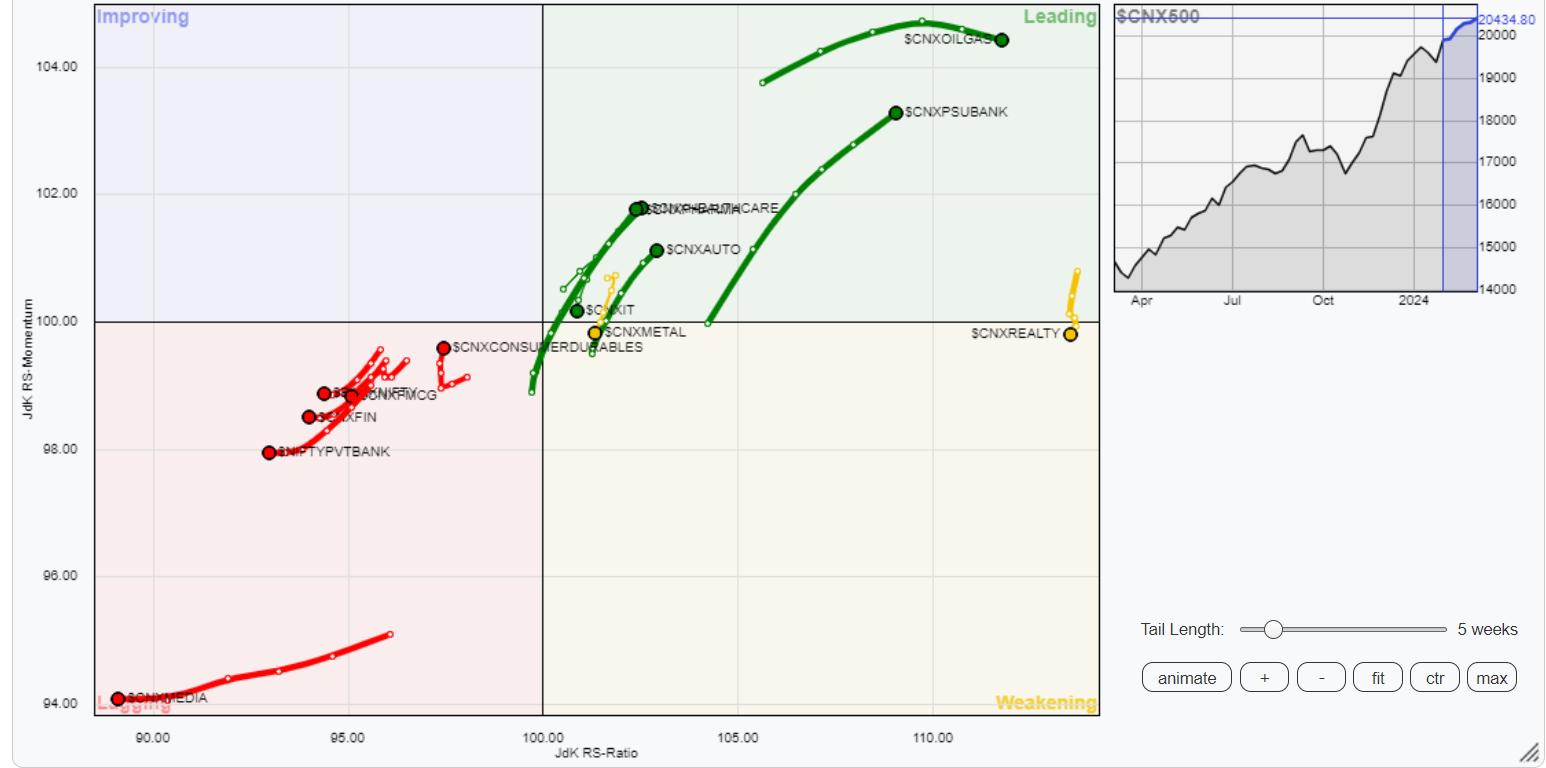
Relative Rotation Graphs (RRG) show that while staying inside the leading quadrant, Nifty IT, Commodities, and the PSE groups are showing a slowdown in their relative momentum against the broader markets. Besides this, PSU Banks, Pharma, Infrastructure, and Auto indices are inside the leading quadrant and may continue to relatively outperform the broader markets.
The Realty Index is back inside the weakening quadrant and so is the Metal Index. These two sectors along with the Nifty Midcap 100 index which is also in the weakening quadrant may see their relative performance slowing down while they may continue to perform on an individual basis.
Nifty FMCG, Financial Services, Service Sector Index, Banknifty, and Media continue to languish inside the lagging quadrant. The Consumption Index is also inside the lagging quadrant but appears to be improving on its relative momentum.
No sectors are present inside the improving quadrant.
Important Note: RRG™ charts show the relative strength and momentum of a group of stocks. In the above Chart, they show relative performance against NIFTY500 Index (Broader Markets) and should not be used directly as buy or sell signals.
Milan Vaishnav, CMT, MSTA
Consulting Technical Analyst