


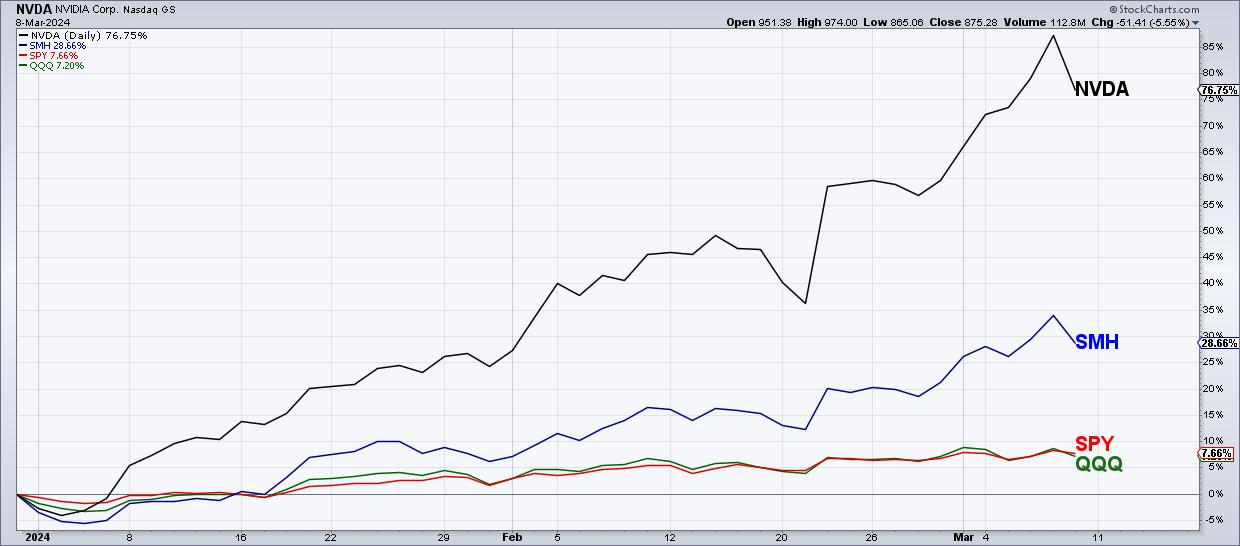
Large-cap growth stocks have been outperforming for quite some time, with semiconductors perhaps the most representative of the strength of that trade in recent months. In fact, the semiconductor ETF (SMH) finished the week up 29% year-to-date, far outpacing the S&P 500 and Nasdaq 100, which are both up about 7.5% in 2024.

Nvidia (NVDA) has been perhaps the most overheated of the Magnificent 7 stocks, gaining over 87% in 2024 through Thursday’s close. Friday, however, saw NVDA open higher and close lower, creating the dreaded bearish engulfing pattern. Does this mean the top is in for Nvidia?
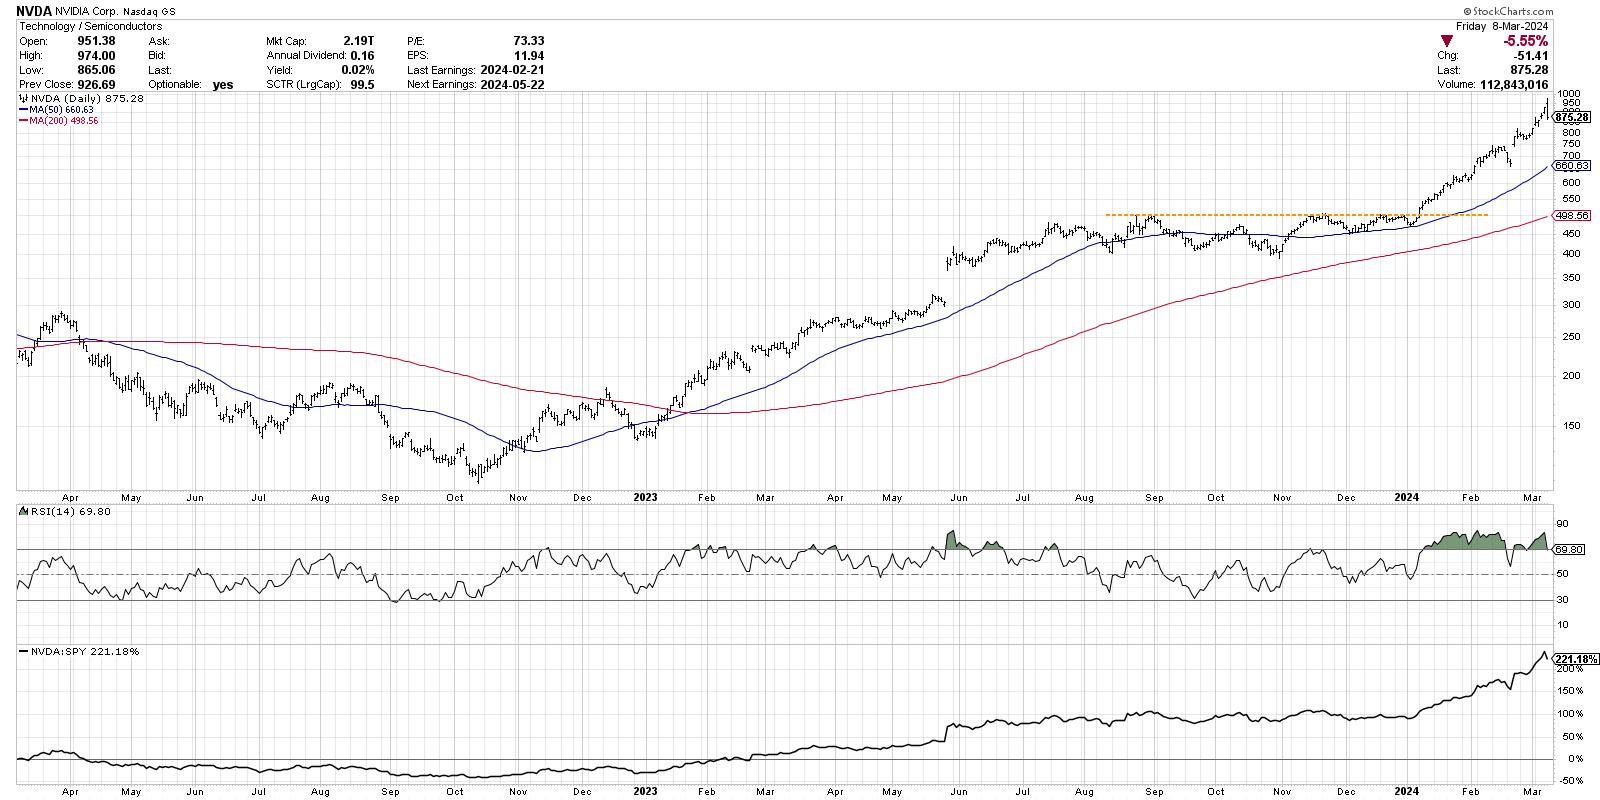
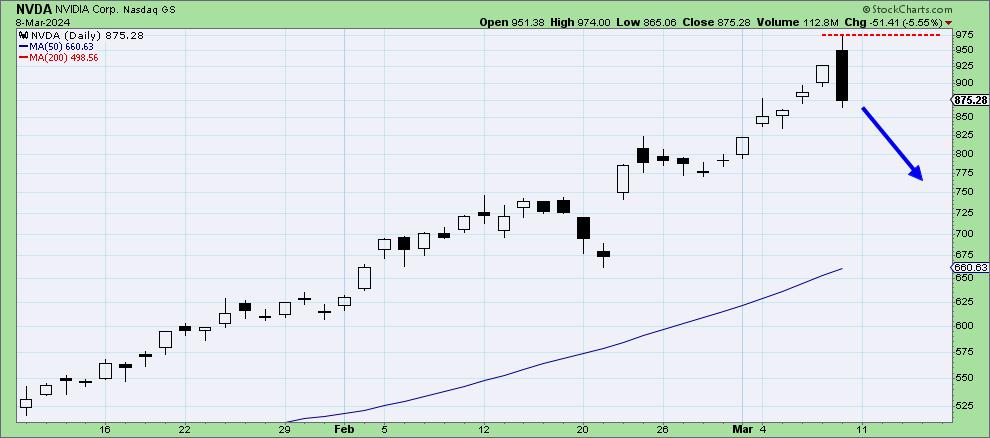
Let’s start by reviewing the long-term trend going into this week, which has been nothing short of exceptional. After breaking above resistance around $500 in early January, Nvidia embarked on a consistent uptrend of higher highs and higher lows. NVDA almost doubled in value through this week, reaching an intraday high of $974 on Friday. But the lower close is what really tells the story here.
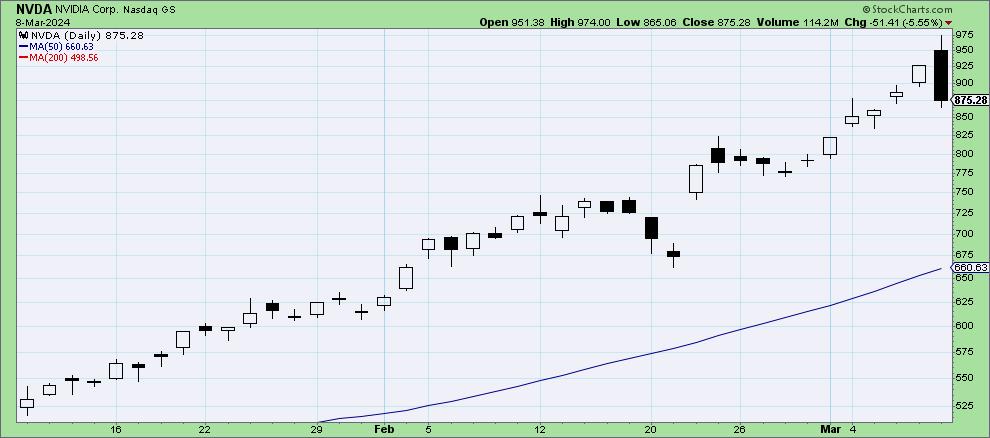
A bearish engulfing pattern is a classic two-bar reversal pattern where an up close, if followed by a down close, and day two’s real body “engulfs” the range of day one’s real body. The intraday chart for these two days shows how the short-term price action demonstrates a true reversal in sentiment.
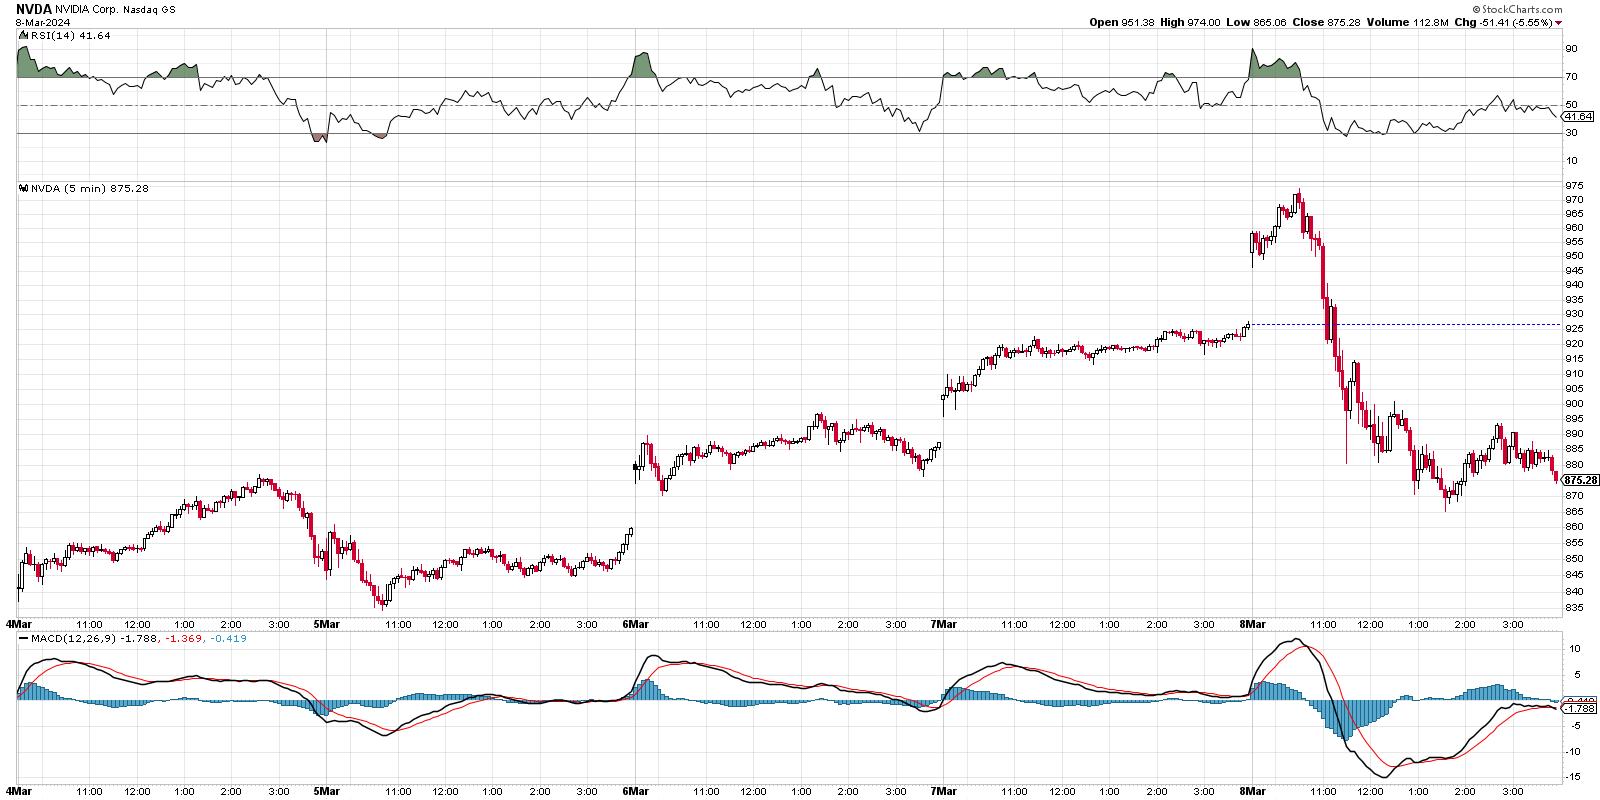
Now we’re seeing this week’s price action using 5-minute candles. Note how Thursday’s rally continued the upward trajectory that really began on Tuesday going into the close. Friday saw a big gap higher at the open, but, after an initial rally, NVDA turned lower and continued this pullback into the afternoon. By the close, Nvidia finished well below Thursday’s trading range, creating the bearish engulfing pattern.
The good news is about two-bar candle patterns is that they provide a built-in risk management system! Steve Nison is generally credited with bringing candlestick charting, a traditional Japanese form of technical analysis, and promoting its merits to Western technical analysts. I spoke with Steve years ago about reversal patterns, and he noted that the high of the two-bar bearish engulfing pattern can be used as a simple stop-loss technique.
So, if NVDA would push above the $975 level next week, based on Friday’s intraday high, that would negate the reversal pattern and suggest further upside potential. Otherwise, the bearish implication of this pattern remains in place, and suggests that semiconductors may be in for a pullback as we continue through the month of March.
Author’s note: I’ve set a price alert for NVDA breaking above $975 using the Technical Alert Workbench, and I’d encourage you to do the same!
If we assume that “the top” is in, at least for now, then how can we identify some potential downside targets for Nvidia?
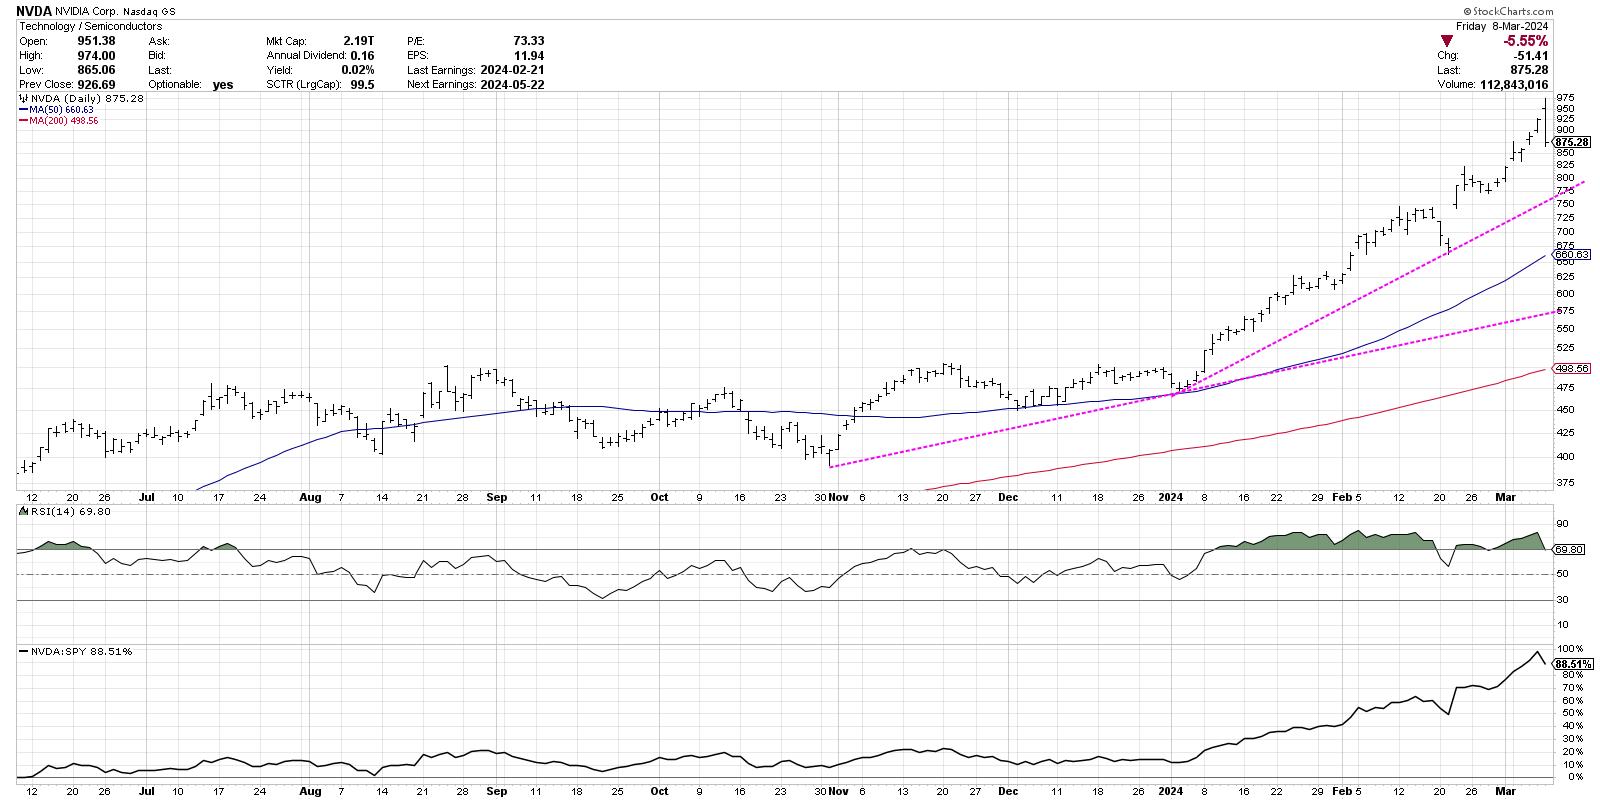
A trendline based on the major lows in 2024 yields a downside objective around $760-775, depending on how quickly a pullback would occur. This would also line up fairly well with Nvidia’s most recent swing low, around $775. If this level would fail to hold, I’d key in on the 200-day moving average, which currently sits around $660.
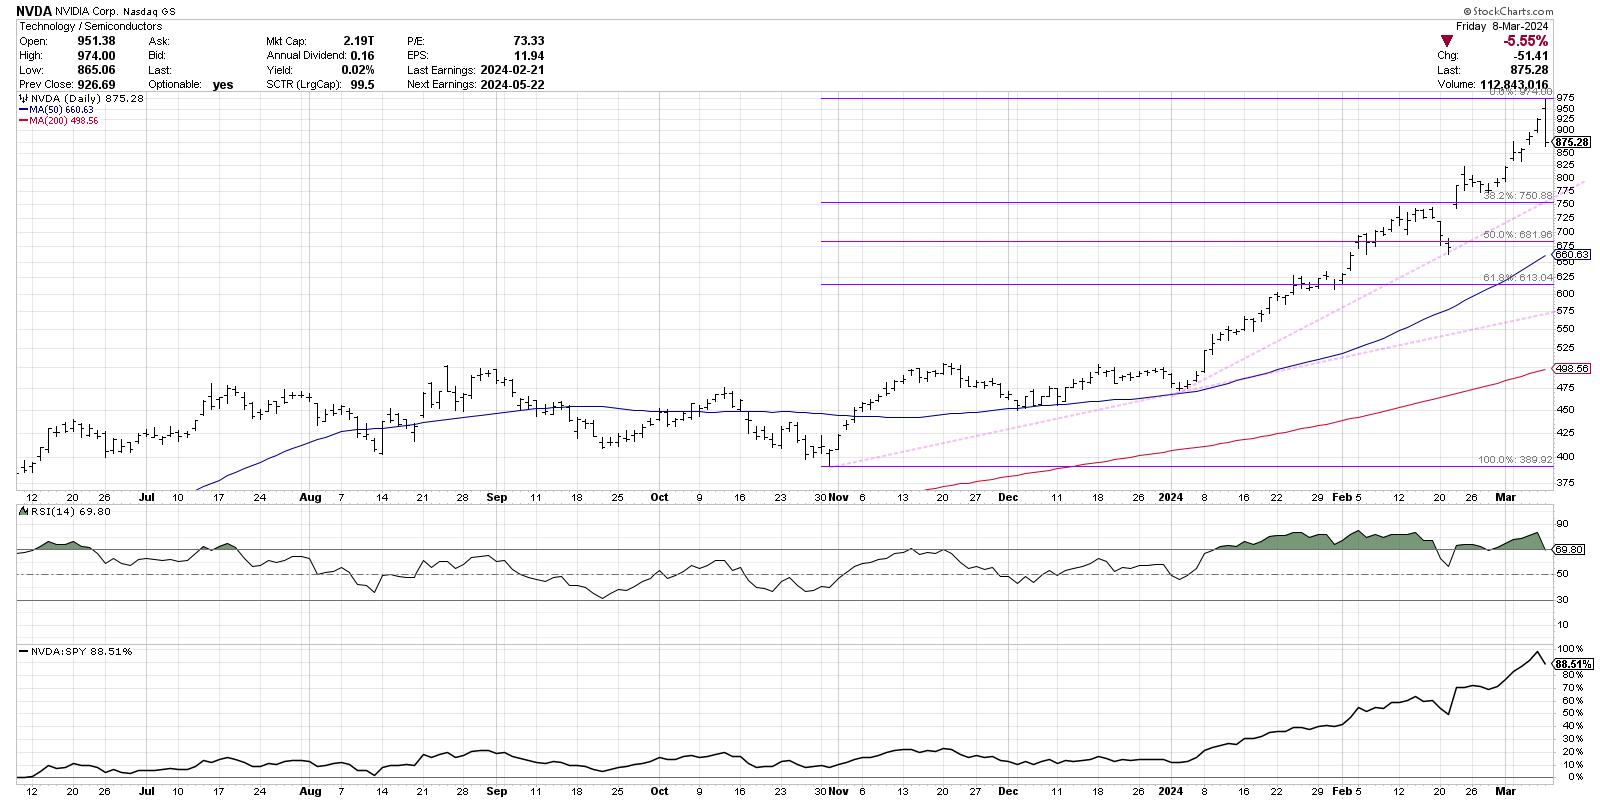
A quick Fibonacci analysis would suggest an initial downside target around $750, which would represent a 38.2% retracement of the October 2023 low to the recent high around $975. The 200-day moving average also lines up well with the 50% retracement level around $682, giving additional emphasis to this as a potential downside support level.
As I mentioned at the beginning of this article, I would consider charts like Nvidia to be innocent until proven guilty. This means an uptrend is in place as long as we continue to observe a pattern of higher highs and higher lows. But, by noticing a bearish engulfing pattern on NVDA, as well as on the S&P 500 and Nasdaq 100, we can anticipate how short-term price reversals could indeed manifest into broader declines that could catch investors by surprise!
RR#6,
Dave
P.S. Ready to upgrade your investment process? Check out my free behavioral investing course!
David Keller, CMT
Chief Market Strategist
StockCharts.com
Disclaimer: This blog is for educational purposes only and should not be construed as financial advice. The ideas and strategies should never be used without first assessing your own personal and financial situation, or without consulting a financial professional.
The author does not have a position in mentioned securities at the time of publication. Any opinions expressed herein are solely those of the author and do not in any way represent the views or opinions of any other person or entity.